#| standalone: true
#| viewerHeight: 600
library(shiny)
library(bslib)

# Define UI for application that draws a histogram
ui <- fluidPage(

    # Application title
    titlePanel("Old Faithful Geyser Data"),

    # Sidebar with a slider input for number of bins
    sidebarLayout(
        sidebarPanel(
            sliderInput("bins",
                        "Number of bins:",
                        min = 1,
                        max = 50,
                        value = 30)
        ),

        # Show a plot of the generated distribution
        mainPanel(
           plotOutput("distPlot")
        )
    )
)

# Define server logic required to draw a histogram
server <- function(input, output) {

    output$distPlot <- renderPlot({
        # generate bins based on input$bins from ui.R
        x    <- faithful[, 2]
        bins <- seq(min(x), max(x), length.out = input$bins + 1)

        # draw the histogram with the specified number of bins
        hist(x, breaks = bins, col = 'darkgray', border = 'white',
             xlab = 'Waiting time to next eruption (in mins)',
             main = 'Histogram of waiting times')
    })
}

# Run the application
shinyApp(ui = ui, server = server)
A second shinylive code block with a second Shiny app
#| standalone: true
#| viewerHeight: 800
library(shiny)
library(bslib)

# Define UI for dataset viewer app ----
ui <- fluidPage(

  # App title ----
  titlePanel("Shiny Text"),

  # Sidebar layout with a input and output definitions ----
  sidebarLayout(

    # Sidebar panel for inputs ----
    sidebarPanel(

      # Input: Selector for choosing dataset ----
      selectInput(inputId = "dataset",
                  label = "Choose a dataset:",
                  choices = c("rock", "pressure", "cars")),

      # Input: Numeric entry for number of obs to view ----
      numericInput(inputId = "obs",
                   label = "Number of observations to view:",
                   value = 10)
    ),

    # Main panel for displaying outputs ----
    mainPanel(

      # Output: Verbatim text for data summary ----
      verbatimTextOutput("summary"),

      # Output: HTML table with requested number of observations ----
      tableOutput("view")

    )
  )
)

# Define server logic to summarize and view selected dataset ----
server <- function(input, output) {

  # Return the requested dataset ----
  datasetInput <- reactive({
    switch(input$dataset,
           "rock" = rock,
           "pressure" = pressure,
           "cars" = cars)
  })

  # Generate a summary of the dataset ----
  output$summary <- renderPrint({
    dataset <- datasetInput()
    summary(dataset)
  })

  # Show the first "n" observations ----
  output$view <- renderTable({
    head(datasetInput(), n = input$obs)
  })

}

# Create Shiny app ----
shinyApp(ui = ui, server = server)
Source Code
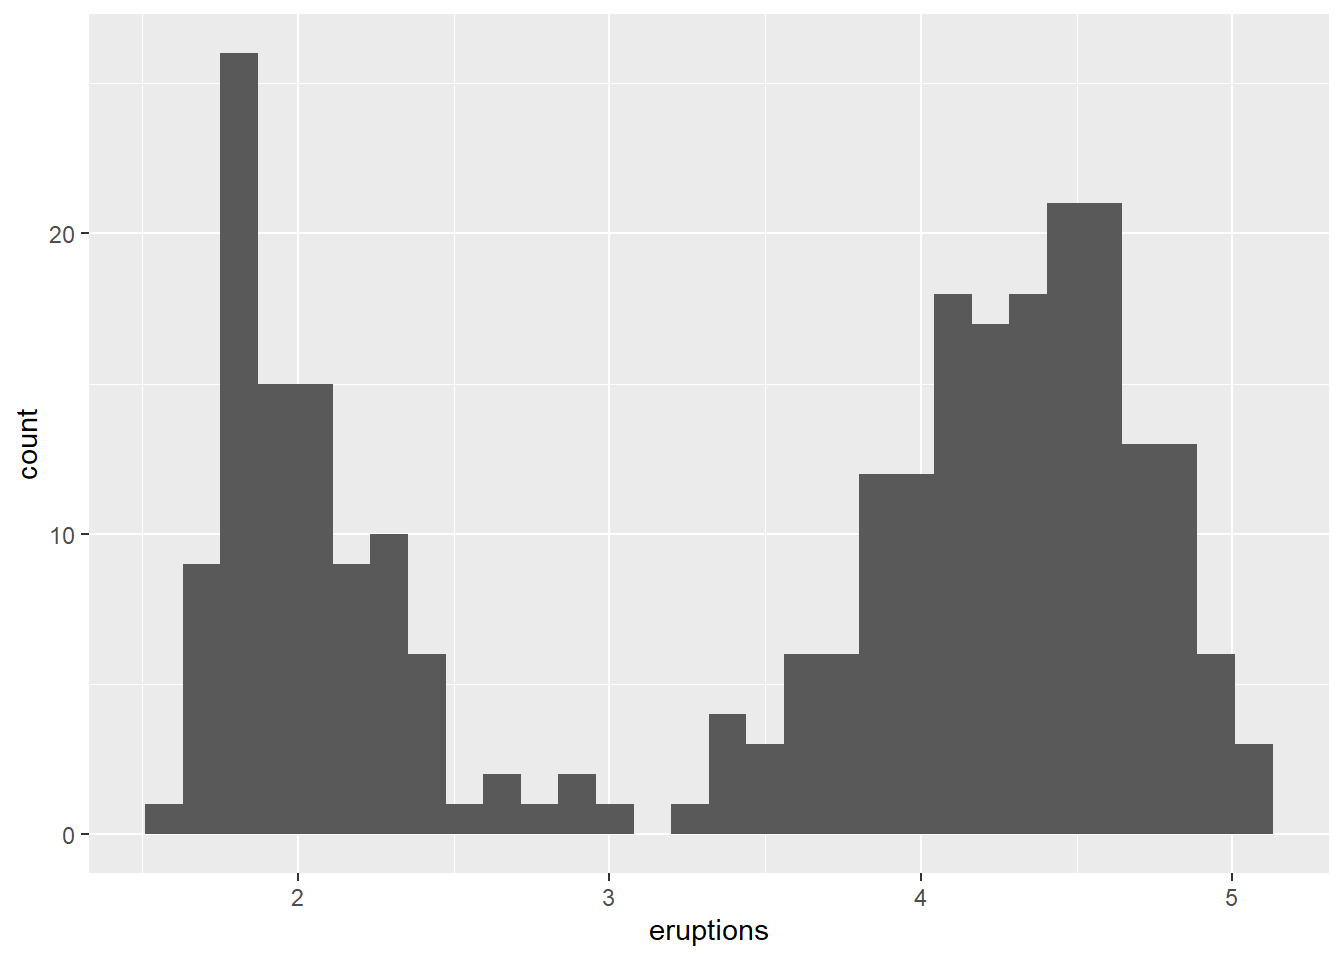
---title: "Testing shinylive extension in Quarto documents"author: "Johannes Feldhege"format: html: code-tools: truefilters: - shinylive---# A basic non-interactive plot```{r}library(ggplot2)ggplot(faithful, aes(x = eruptions)) +geom_histogram(bins =30)```# A Shinylive code block with a basic Shiny app```{shinylive-r}#| standalone: true#| viewerHeight: 600library(shiny)library(bslib)# Define UI for application that draws a histogramui <- fluidPage( # Application title titlePanel("Old Faithful Geyser Data"), # Sidebar with a slider input for number of bins sidebarLayout( sidebarPanel( sliderInput("bins", "Number of bins:", min = 1, max = 50, value = 30) ), # Show a plot of the generated distribution mainPanel( plotOutput("distPlot") ) ))# Define server logic required to draw a histogramserver <- function(input, output) { output$distPlot <- renderPlot({ # generate bins based on input$bins from ui.R x <- faithful[, 2] bins <- seq(min(x), max(x), length.out = input$bins + 1) # draw the histogram with the specified number of bins hist(x, breaks = bins, col = 'darkgray', border = 'white', xlab = 'Waiting time to next eruption (in mins)', main = 'Histogram of waiting times') })}# Run the application shinyApp(ui = ui, server = server)```# A second shinylive code block with a second Shiny app```{shinylive-r}#| standalone: true#| viewerHeight: 800library(shiny)library(bslib)# Define UI for dataset viewer app ----ui <- fluidPage( # App title ---- titlePanel("Shiny Text"), # Sidebar layout with a input and output definitions ---- sidebarLayout( # Sidebar panel for inputs ---- sidebarPanel( # Input: Selector for choosing dataset ---- selectInput(inputId = "dataset", label = "Choose a dataset:", choices = c("rock", "pressure", "cars")), # Input: Numeric entry for number of obs to view ---- numericInput(inputId = "obs", label = "Number of observations to view:", value = 10) ), # Main panel for displaying outputs ---- mainPanel( # Output: Verbatim text for data summary ---- verbatimTextOutput("summary"), # Output: HTML table with requested number of observations ---- tableOutput("view") ) ))# Define server logic to summarize and view selected dataset ----server <- function(input, output) { # Return the requested dataset ---- datasetInput <- reactive({ switch(input$dataset, "rock" = rock, "pressure" = pressure, "cars" = cars) }) # Generate a summary of the dataset ---- output$summary <- renderPrint({ dataset <- datasetInput() summary(dataset) }) # Show the first "n" observations ---- output$view <- renderTable({ head(datasetInput(), n = input$obs) })}# Create Shiny app ----shinyApp(ui = ui, server = server)```